Database of curated and re-analyzed gene expression studies
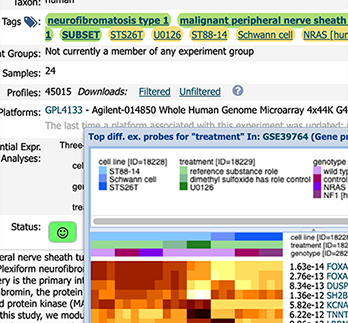
Gemma provides data, experimental design annotations, and differential expression analysis results for thousands of microarray and RNA-seq experiments. We re-analyze raw data from public sources (primarily NCBI GEO), annotate experimental conditions, conduct quality control and compute differential expression using standardized procedures. We have especially good coverage of experiments relevant to the nervous system. See the documentation for more information. Gemma was developed and is maintained by the Pavlidis group at UBC.
May 2025: We are happy to announce that Gemma now has support for single-cell/single-nucleus data. While work is still in progress, you can start using data now. We're providing some additional details here.
Convenient programmatic access to Gemma's data and analyses is available via the software packages gemma.R (R/Bioconductor) and gemmapy (Python).
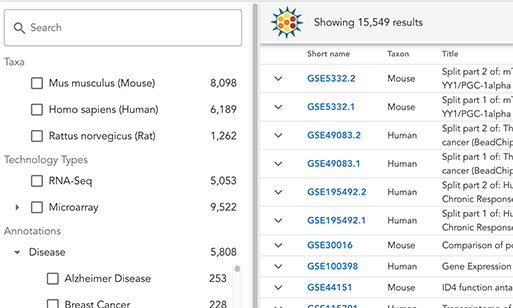
We invite you to try out the new Gemma Browser, our new interface for exploring and searching Gemma's data holdings. We'd love to hear your feedback.
Questions? Feel free to reach out.